Data Visualizations
We built these interactive data visualization apps using RShiny to allow you to form hypotheses about biological responses to climate change and test them using data. One thing we love about these examples is that they take advantage of both climatic gradients and historical data to really help us understand and predict the effects of climate change. Each case study includes all the background you need to understand the data and an interactive interface you can use to visualize it in different ways. Worksheets with additional background and questions designed to promote inquiry-based learning are available on the resources page. The visualizations listed below start with organismal level responses to climate change and proceed to population level responses.
Introduction to Interpreting Graphs: Use historic butterfly museum specimen data to understand and identify trends and relationships through graphical representation.
Metabolic Impacts of Climate Change: Use historic climate data and the temperature dependence of metabolism to compare climate impacts between temperate and tropical regions.
Energy Budgets: Using a heat budget model to estimate an organism’s body temperature due to their environment and morphology.
Robomussels: Use data from biomimetic temperature sensors to explore how organisms experience climate.
Butterfly Museum Specimens: Use data from museum specimens to explore how temperature influences morphology and phenology.
Wildflower Phenology: Use historical and resurvey data to explore how temperature influences phenology.
RMBL Phenology: Use climate and phenological data from Rock Mountain Biological Laboratory to explore migration and overwintering species in a high-elevation ecosystem.
Grasshopper Resurvey: Use historical and resurvey data to explore how temperature influences developmental rates and phenology. Also, meet one of the scientists behind this project here!
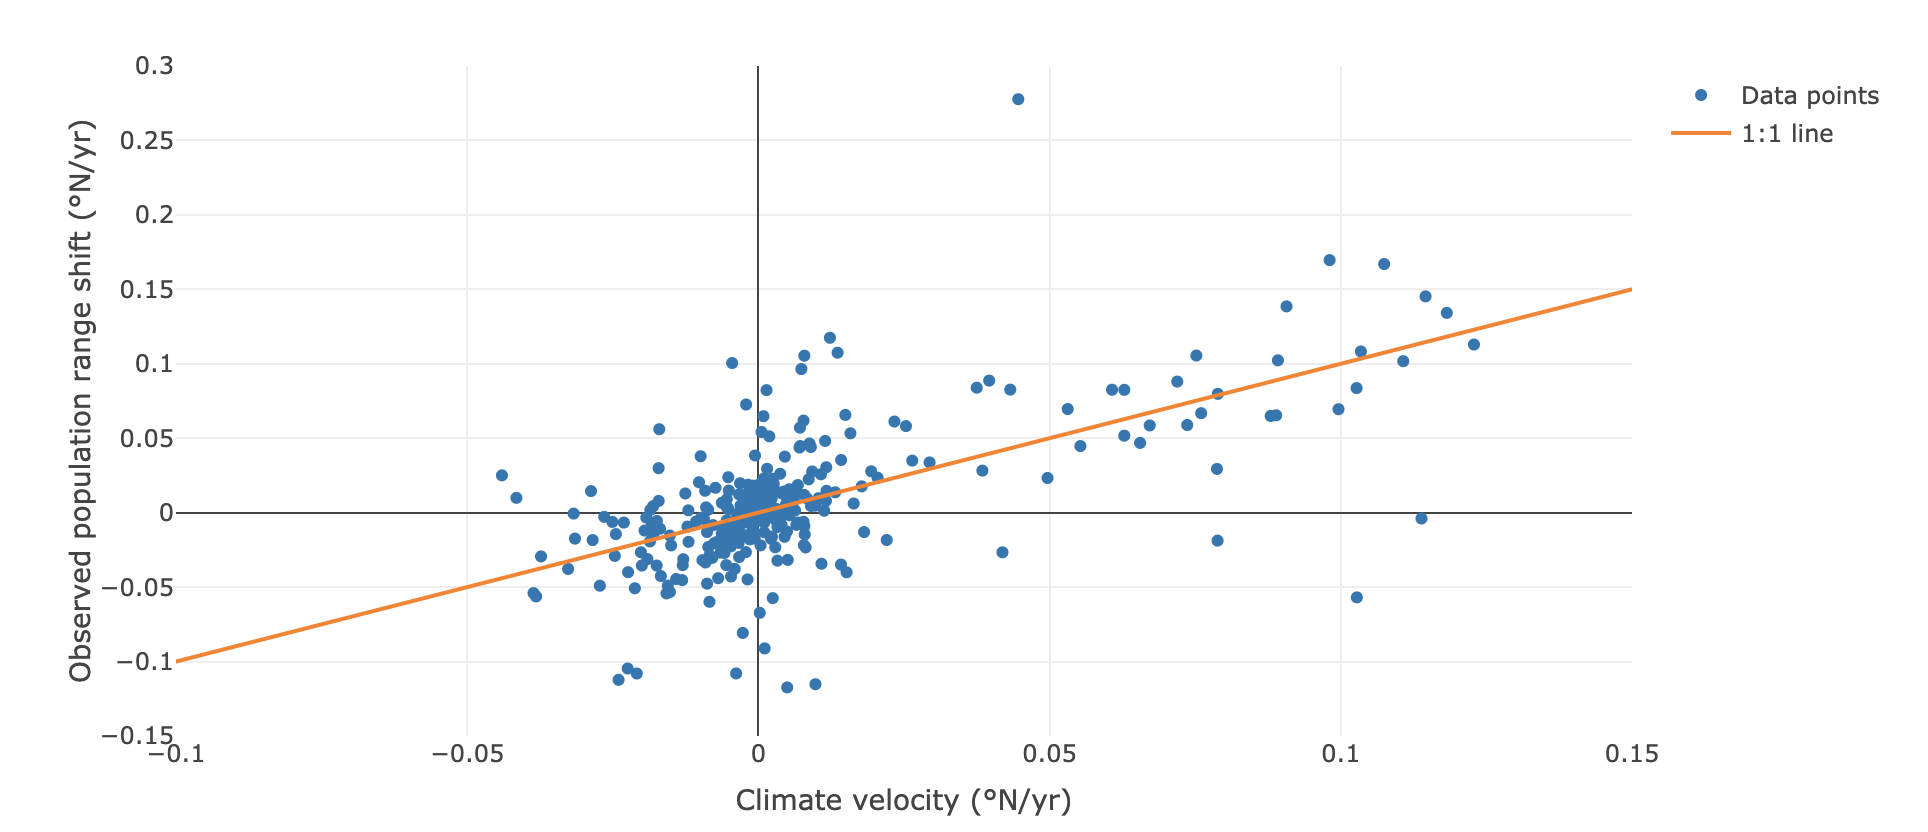
Marine Range Shifts: Use survey data to explore the range shifting of marine populations in response to climate change.