Historical Data
Looking to the past for answers
A major challenge in trying to figure out how living things will respond to changes in our climate that are happening over time is… time itself. Although climate change is actually happening faster than we had expected, it still takes many years of observations before we can begin to see long-term patterns in biological responses. That’s why, although most scientists didn’t begin to seriously sound the alarm about climate change until the 1980s, the case studies on this website rely on data recorded decades earlier. Past scientific studies and museum specimens that were originally collected for other purposes have proven to be incredibly useful for understanding both how life on earth has already changed with climate, as well as what the future holds.
One reason historical records are so valuable is that they help to address the problem of shifting baselines. Fisheries scientist named Daniel Pauly first used this term in 1995 to describe how our ideas about what is “normal” or “extreme” (i.e. our “baselines”) shift unconsciously over time as our experiences change. One clever study searched newspaper headlines published between 1869 and 2015, pulling out headlines where a superlative like giant, huge, or monster was used to describe a fish that had been caught. For many overfished species, such as whale sharks, the authors found declines in the lengths of fish that made the headlines—meaning newsworthy fish don’t have to be as big as they used to be. Examining historic datasets is one way to guard against the problem of shifting baselines, because it gives us information about how things have changed.
Why repeat the same study?
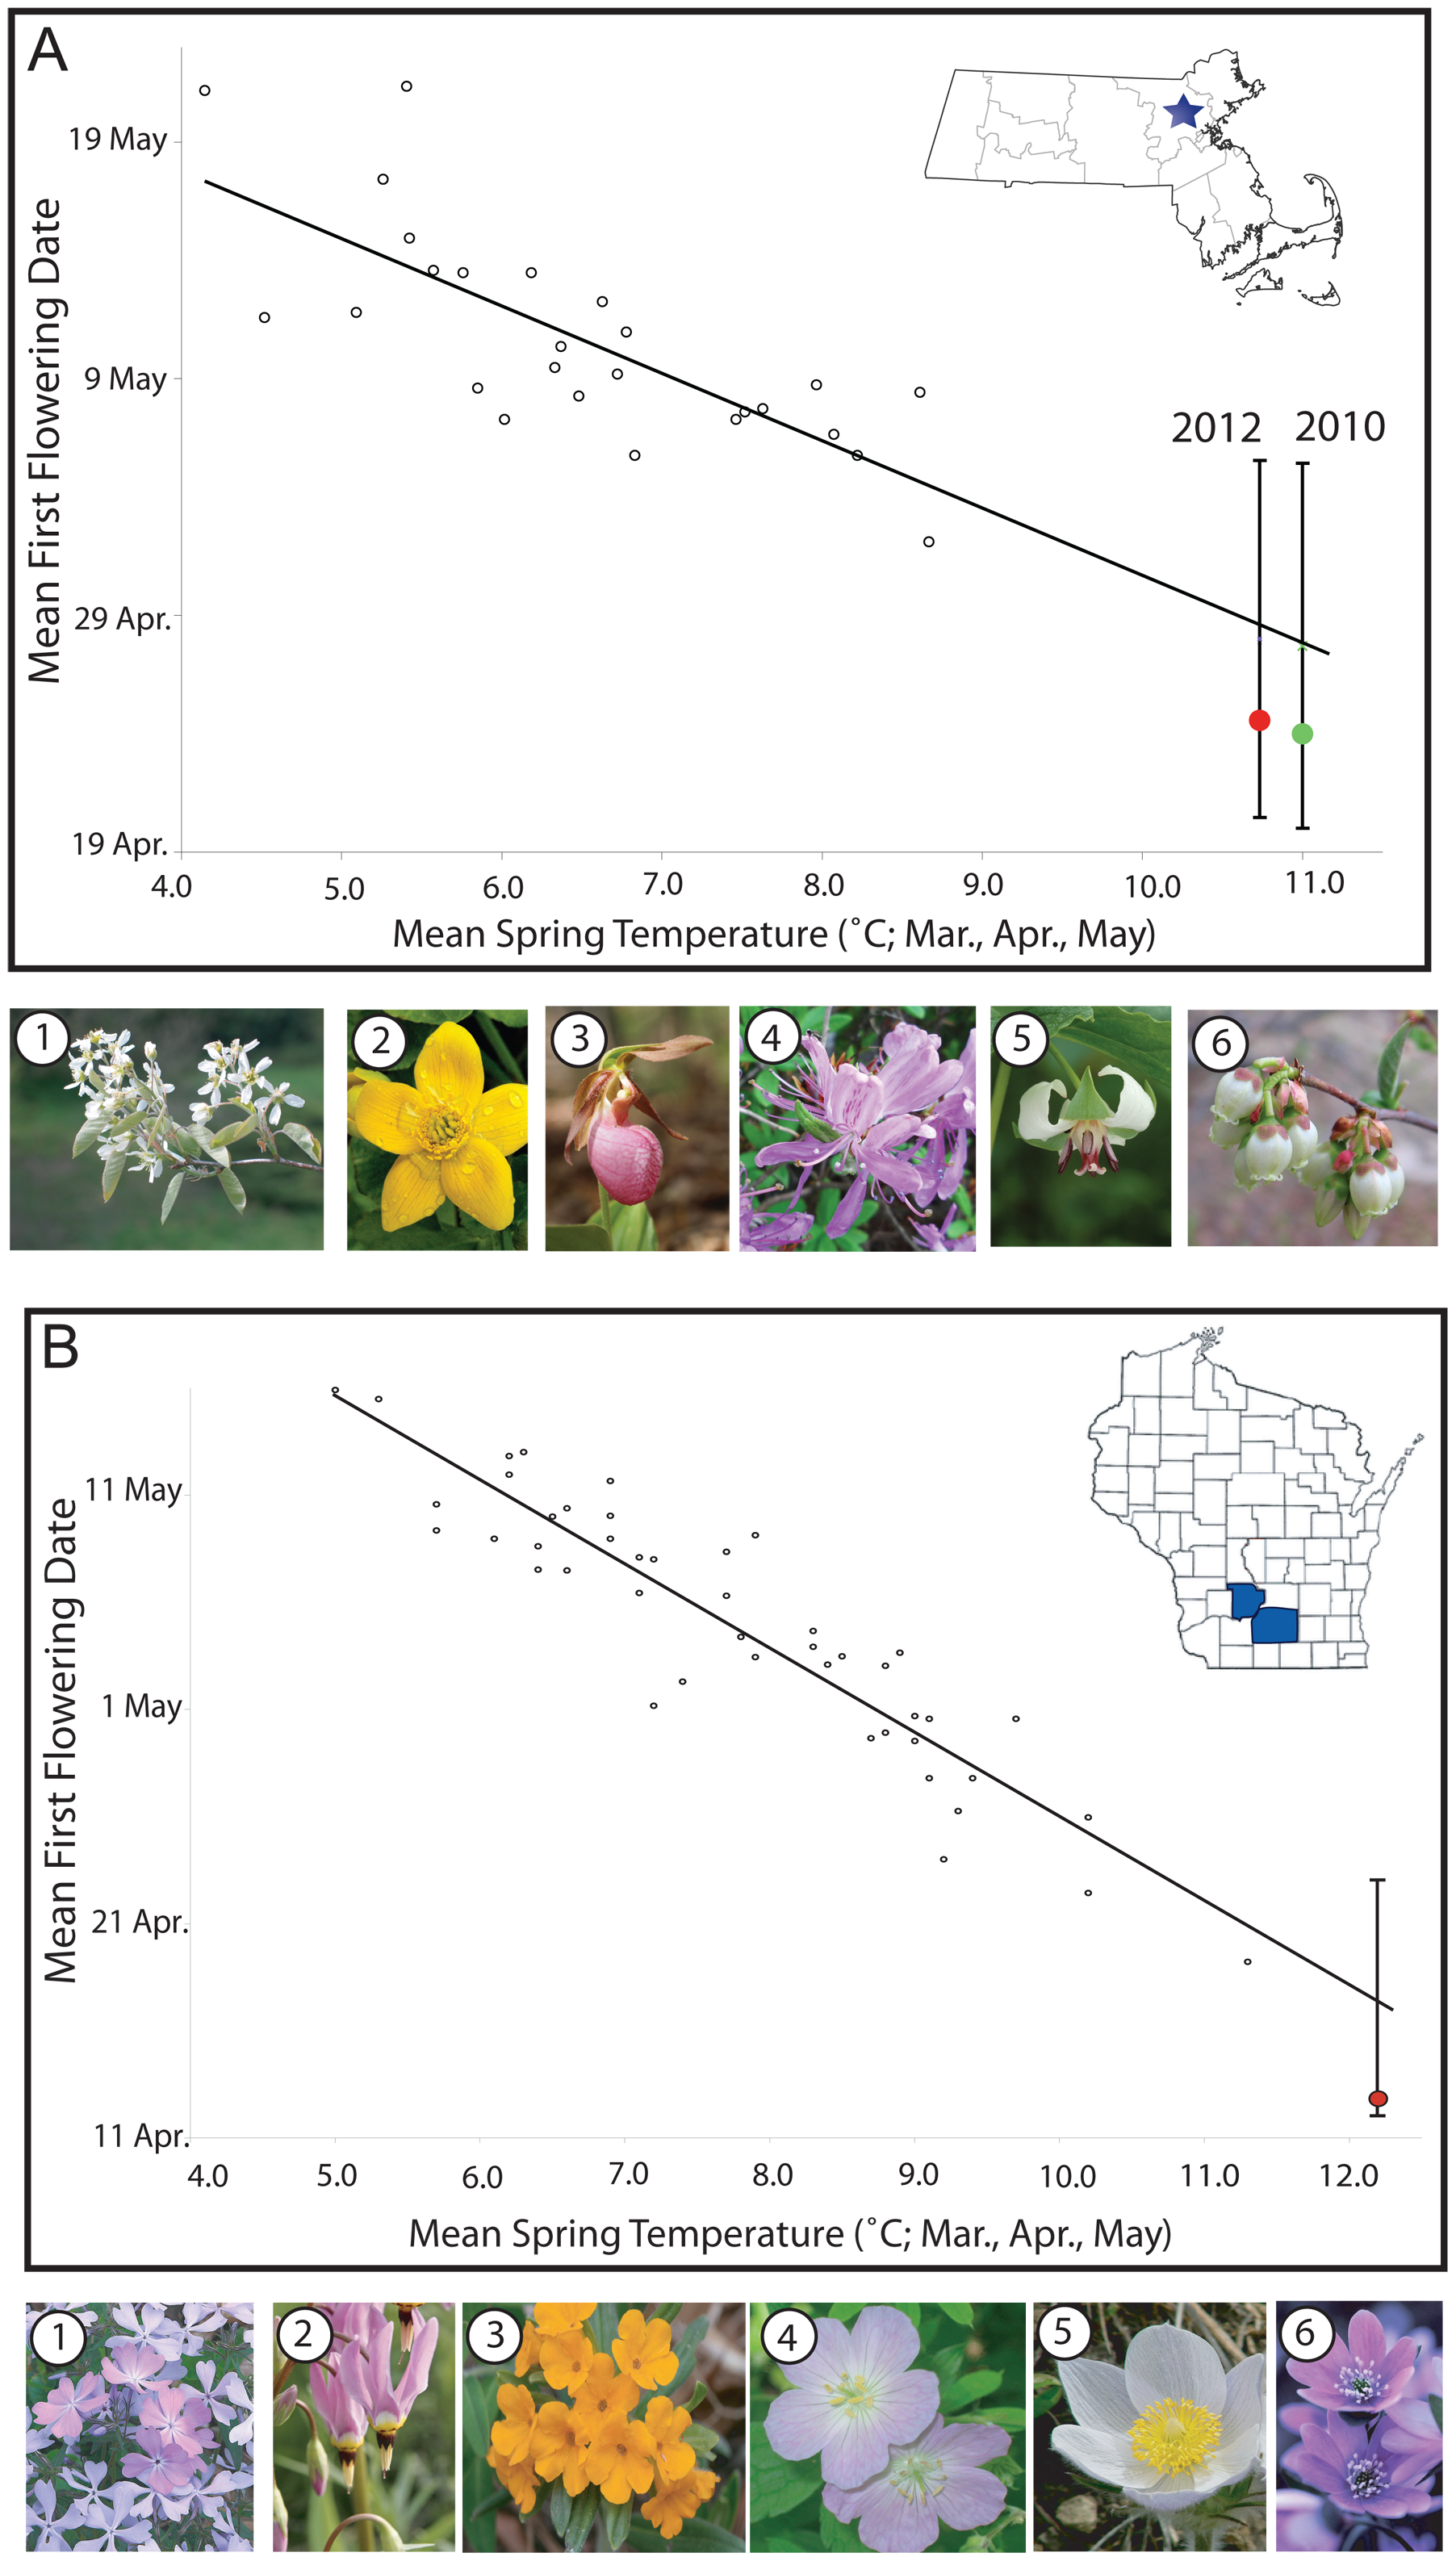
One of the most extraordinary examples of research using historical datasets involves the diaries of the 19th-century American environmentalist and writer Henry David Thoreau, who lived in Concord, Massachusetts. Thoreau was passionate about nature, and between 1851 and 1858 he recorded his observations about 300 different species of plants and birds, including the first dates each season on which he saw trees leafing out, flowers blooming, and migratory birds arriving to breed. Biologist Richard Primack saw the opportunity for a resurvey, a repeat study of the same species in the same area to track changes over time. By combining the tables in Thoreau’s diaries with temperature data from a nearby observatory and his own contemporary observations, a team led by Primack determined that spring temperatures in Concord had warmed by an average of 5°C, and over the same period wildflowers had shifted the phenology of their first flowering dates by an average of ten days. Not only does this kind of work allow us to quantify the amount of change that has already taken place, it also provides a (rough) estimate of how things will change in the future. In this case, we can predict that on average, every 1°C of warming will result in the first appearance of flowers Concord occurring an average of two days earlier. You can explore some of the Concord wildflower data in our Plant Phenology data visualization.
Another famous resurvey project is currently being conducted at the University of California, Berkeley. Researchers at the Museum of Vertebrate Zoology are revisiting hundreds of sites that were originally surveyed between 1904 and 1940 by Joseph Grinnell, the founding director of the museum, and his expedition partner and paleontological collector Annie Montague Alexander. Grinnell and Alexander wanted to document bird and mammal diversity across California because they were interested in biological responses to changing land use. A century later, scientists and students launched The Grinnell Resurvey Project to retrace their footsteps and discover how these species have responded to the effects of climate change in the intervening years.
The value of museum specimens
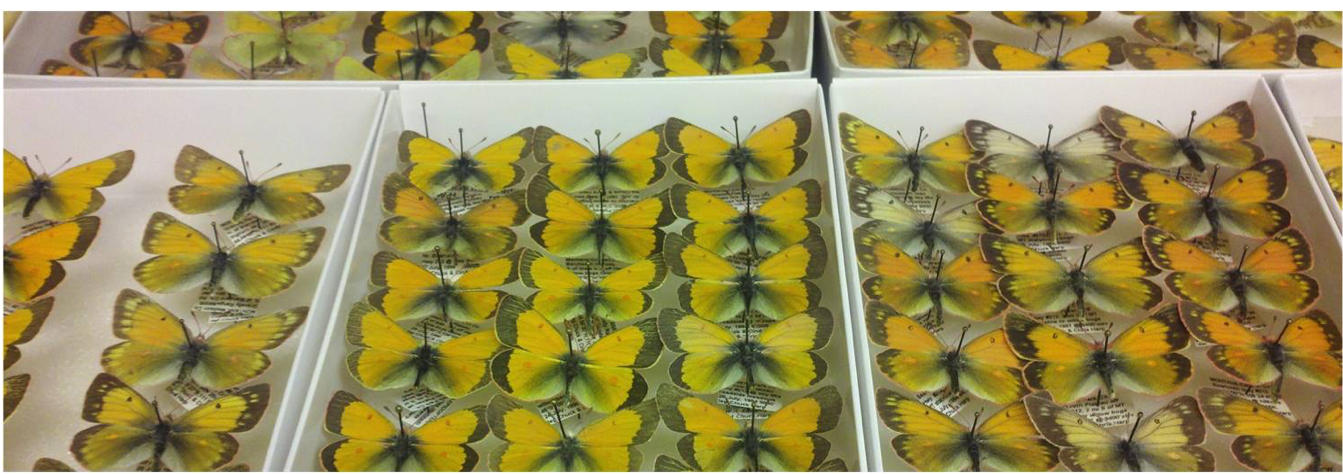
Physical museum collections—preserved specimens, like pressed plants, pinned insects, and bird skins—can be even more exciting sources of historic information than written records. This is because we can often extract additional biological data from these specimens. For example, measurements of museum specimens of two species of North American mice showed that as winters in Southern Quebec warmed, both species experienced changes in skull shape and tooth positioning, which may be related to shifts in their diet caused by changes in vegetation. And in one of the case studies on this website, museum specimens of butterflies were used to measure shifts in wing coloration that occurred with climate change. The development of new technologies that didn’t even exist at the time when some specimens were collected can also increase their scientific value tremendously, including DNA sequencing and other biochemical analyses.